Microsoft Defender can tell you a lot.
But only if the information reaches the people who need to act on it.
On vessels, that is not always straightforward. PCs may report late. Some systems are offline for long periods. Bandwidth is limited. Different vessels may return audit data at different times.
Cyber Detective is designed for that reality.
The Defender Activity view brings Defender health and detection data into the portal so shore teams can review vessel PCs without digging through raw audit output.
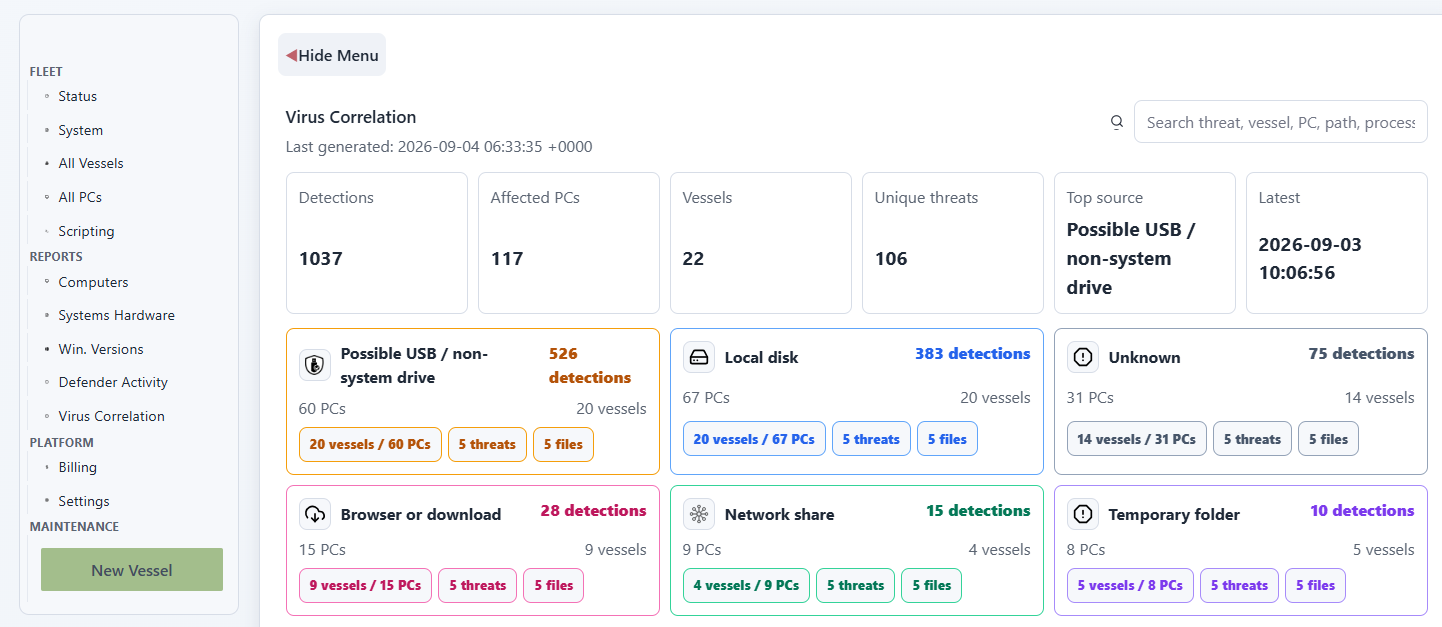
What is in the monitoring view
The Defender monitoring view is designed to answer both health and activity questions.
It can show:
- total Defender detections returned by recent audit data
- affected PCs and affected vessels
- Defender real-time protection state
- tamper protection state
- anti-malware and anti-spyware signature versions
- signature age and last update time
- scan age for quick and full scans
- reboot requirement after Defender activity
- engine and security intelligence versions
- recent threat names and affected computers
- longer-running virus alert history from
VIRUSFOUNDrecords - cross-correlation between threats, vessels, PCs, source types, paths, and processes
This is deliberately practical. The screen is not trying to be a full SIEM. It is trying to give the shore team enough Defender context to decide what to inspect next.
What the Defender view helps answer
The useful questions are usually simple:
- is Defender running?
- are signatures current?
- which PCs have had detections?
- which vessels are affected?
- are detections coming from disk, browser downloads, network shares, or removable media?
- is this a one-off event or a repeated pattern?
Cyber Detective combines these signals into a fleet view.
That matters because a vessel security event is rarely just a single line in an antivirus log. The follow-up often depends on context: where the file was seen, which PC was involved, whether similar events happened elsewhere, and whether the endpoint is still reporting healthy protection status.
From raw Defender output to a usable report
Defender events can include useful details such as threat name, threat ID, severity, category, path, detection origin, detection type, detection source, user, process name, security intelligence version, and engine version.
Cyber Detective extracts those fields where available and presents them as fleet-level report data.
That means the operator can review the same event at different levels:
- fleet summary
- source category
- top threat name
- affected vessel
- affected PC
- raw event details when needed
The raw data remains useful, but it no longer has to be the first place the team starts.
Built around audit data
The report is based on Defender data returned through vessel audits.
That makes it useful for maritime environments where continuous cloud access cannot be assumed. Instead of depending only on a live endpoint session, the portal can present the latest collected facts and make them easier to review.
The goal is not to replace Microsoft Defender.
The goal is to make Defender's output more operational for vessel IT teams.
Why this matters
Security teams do not need more noise.
They need a fast way to see which systems need attention.
By grouping Defender detections across vessel PCs, Cyber Detective helps teams move from "Defender saw something somewhere" to a more useful question:
Which vessel, which PC, what source, and has this happened before?
That is the difference between an alert and a usable fleet security view.